1. INTRODUCTION 2. ACCESS TO REPORTS 3. STRUCTURE AND ORGANIZATION OF INFORMATION 4. GENERAL FUNCTIONING OF REPORTS
1. INTRODUCTION
Reports in Revo XEF are essential for evaluating your business in real-time and making informed decisions.
2. ACCESS TO REPORTS
Easily access them from the back-office and view various types of reports:
3. STRUCTURE AND ORGANIZATION OF INFORMATION
Reports are categorized to facilitate navigation and access to specific data in each area, such as sales and stocks.
Currently, each category has two types of reports available: reportName + old and those with just the report name.
IMPORTANT: Old listings are discontinued but will remain available for a limited time in the back-office under LISTS - OLD LISTS. No further updates will be made to these reports.
4. GENERAL FUNCTIONING OF REPORTS
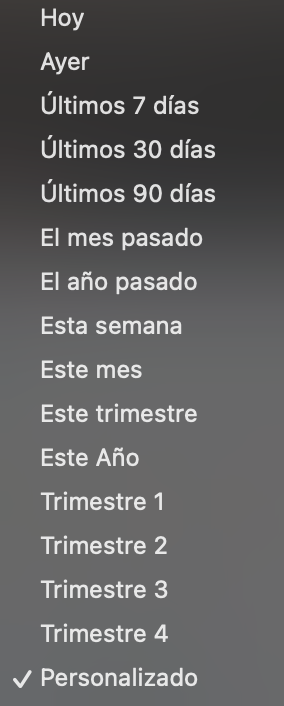
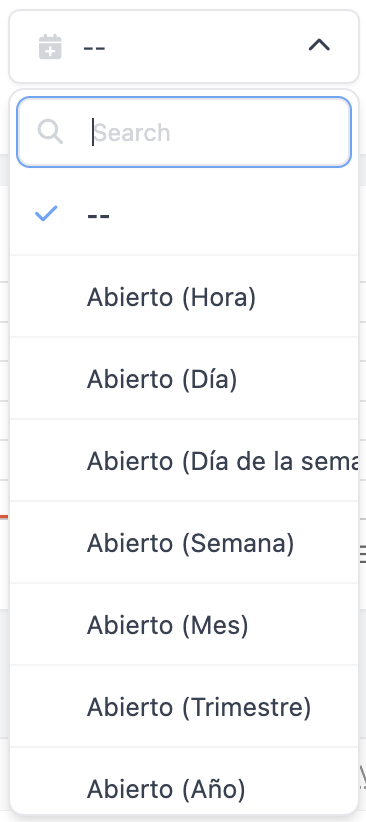
1. Date Ranges:
New ranges have been added to filter and compare data more efficiently.
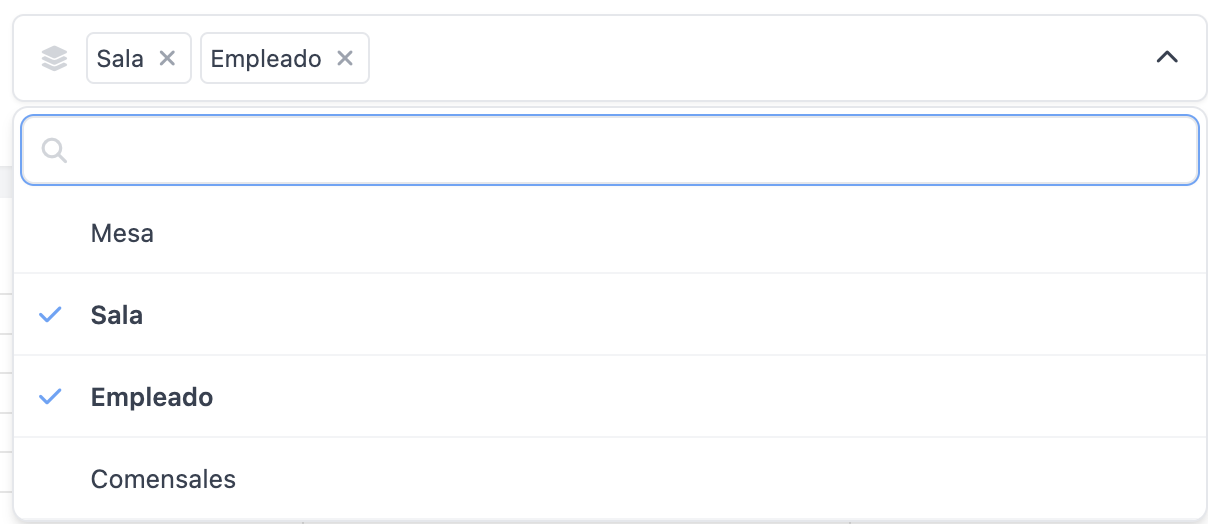
2. Grouping:
The "Grouping" function allows you to view summarized reports using one or two specific fields. For example, in the image below, you see an order report grouped by room and employee, showing totals by waiter and room.
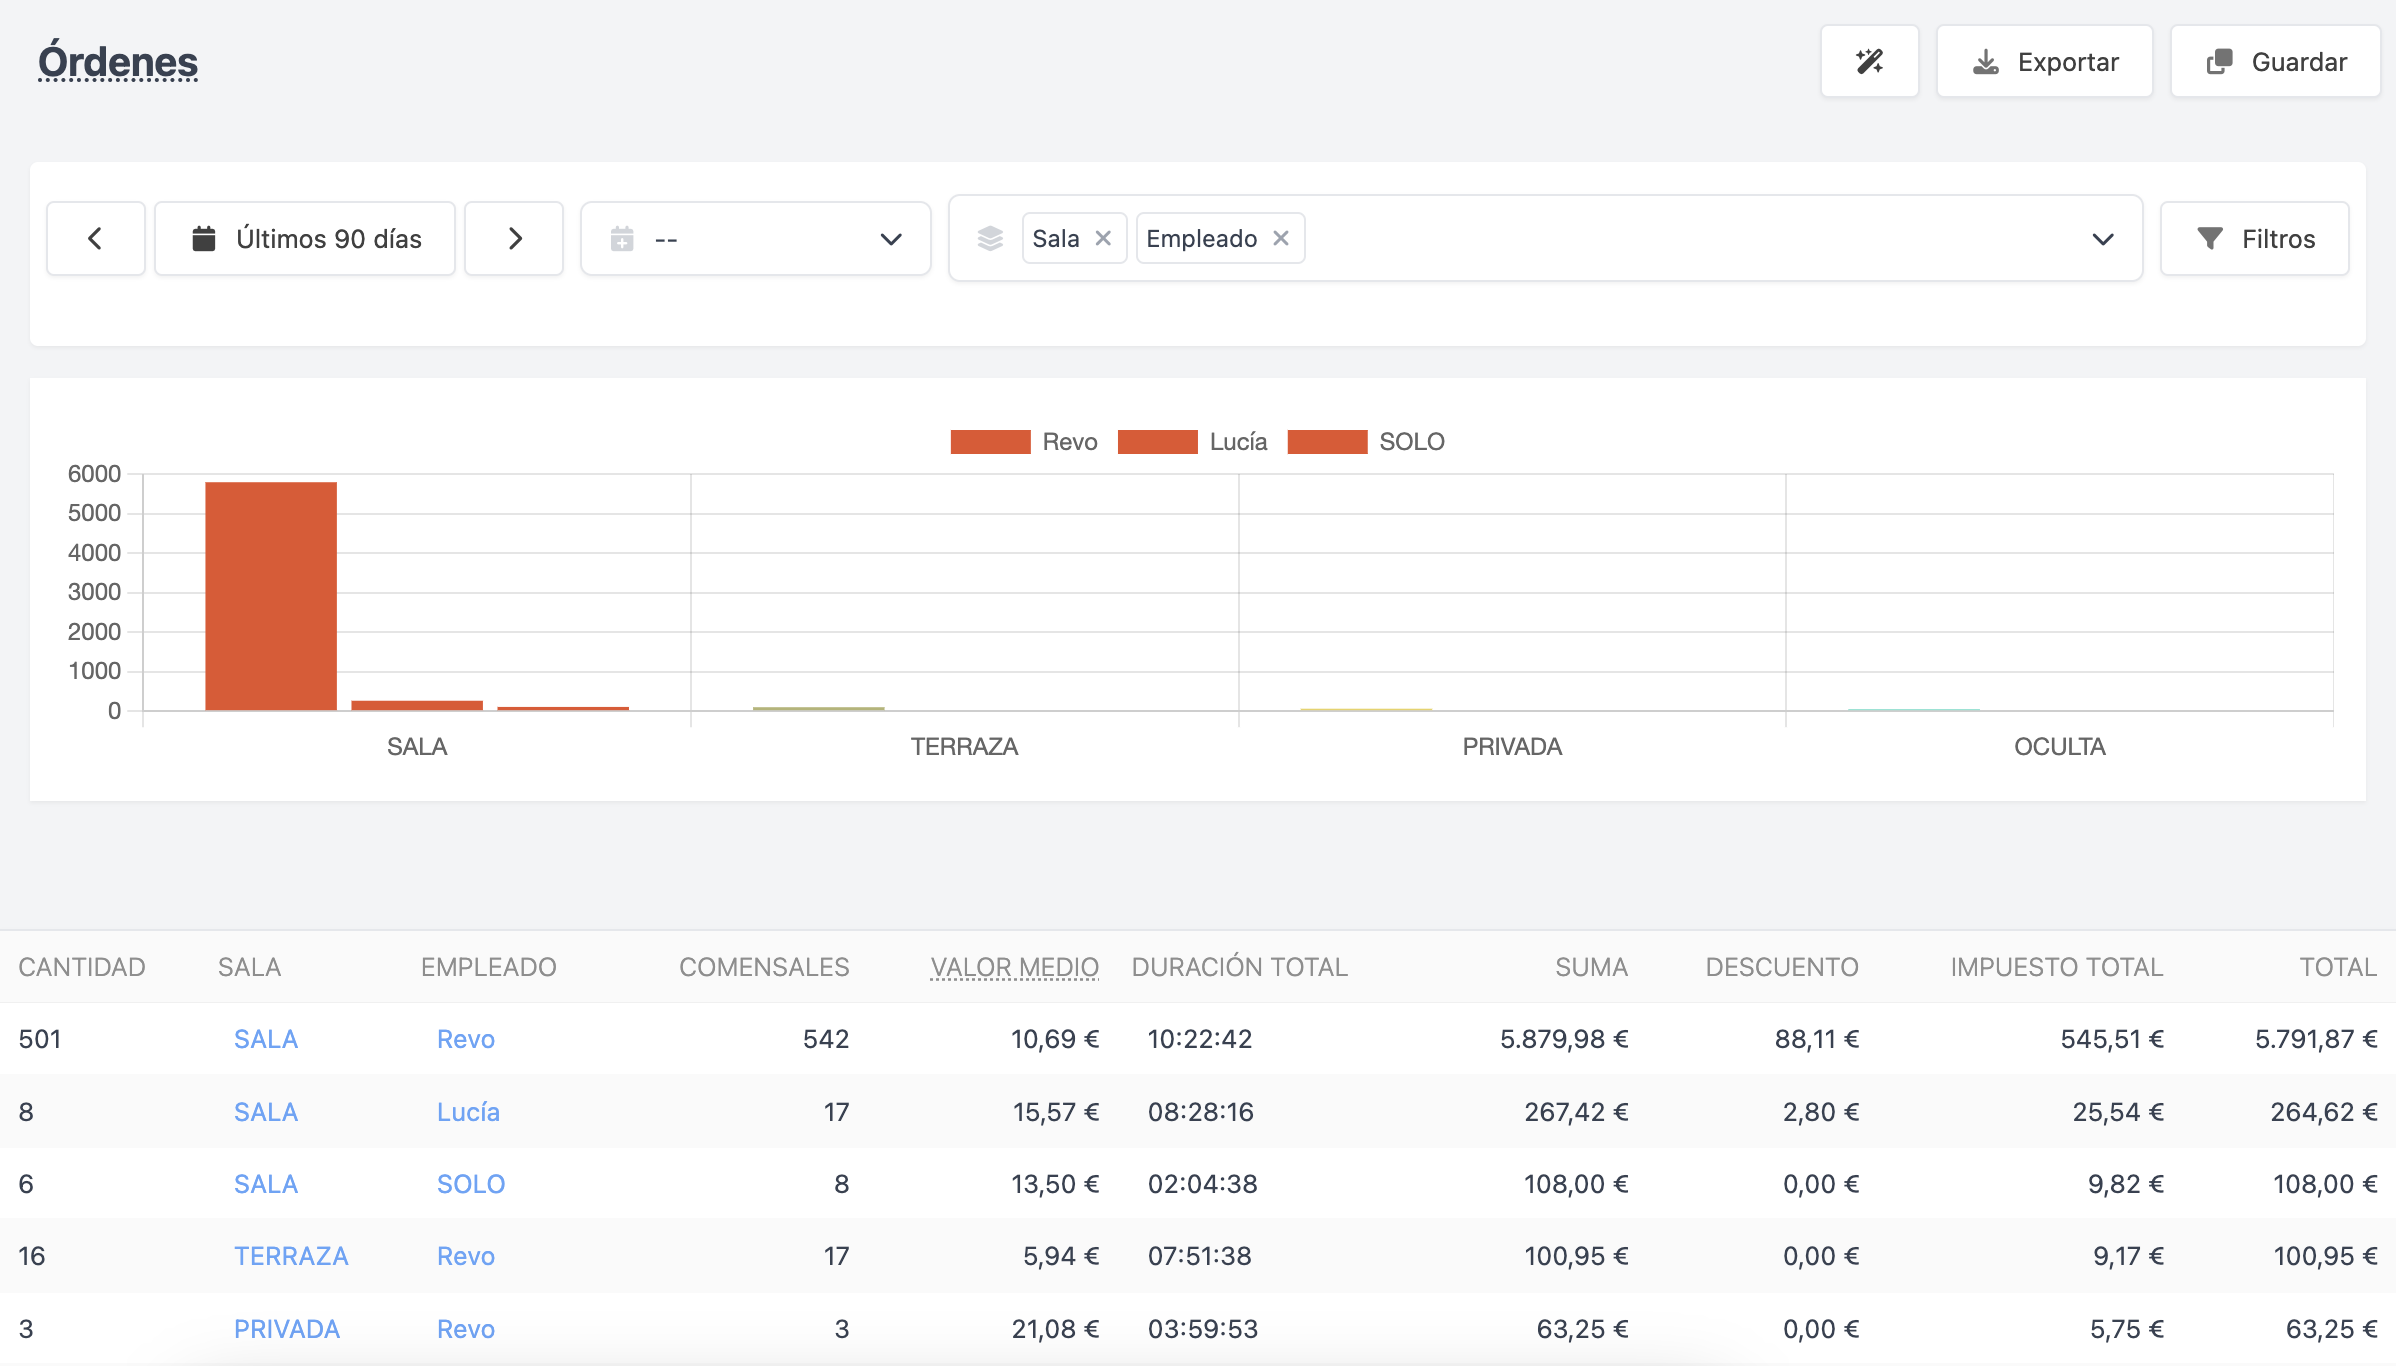
To group, click on "Group by...", and select the available fields for each report (date fields are always available).
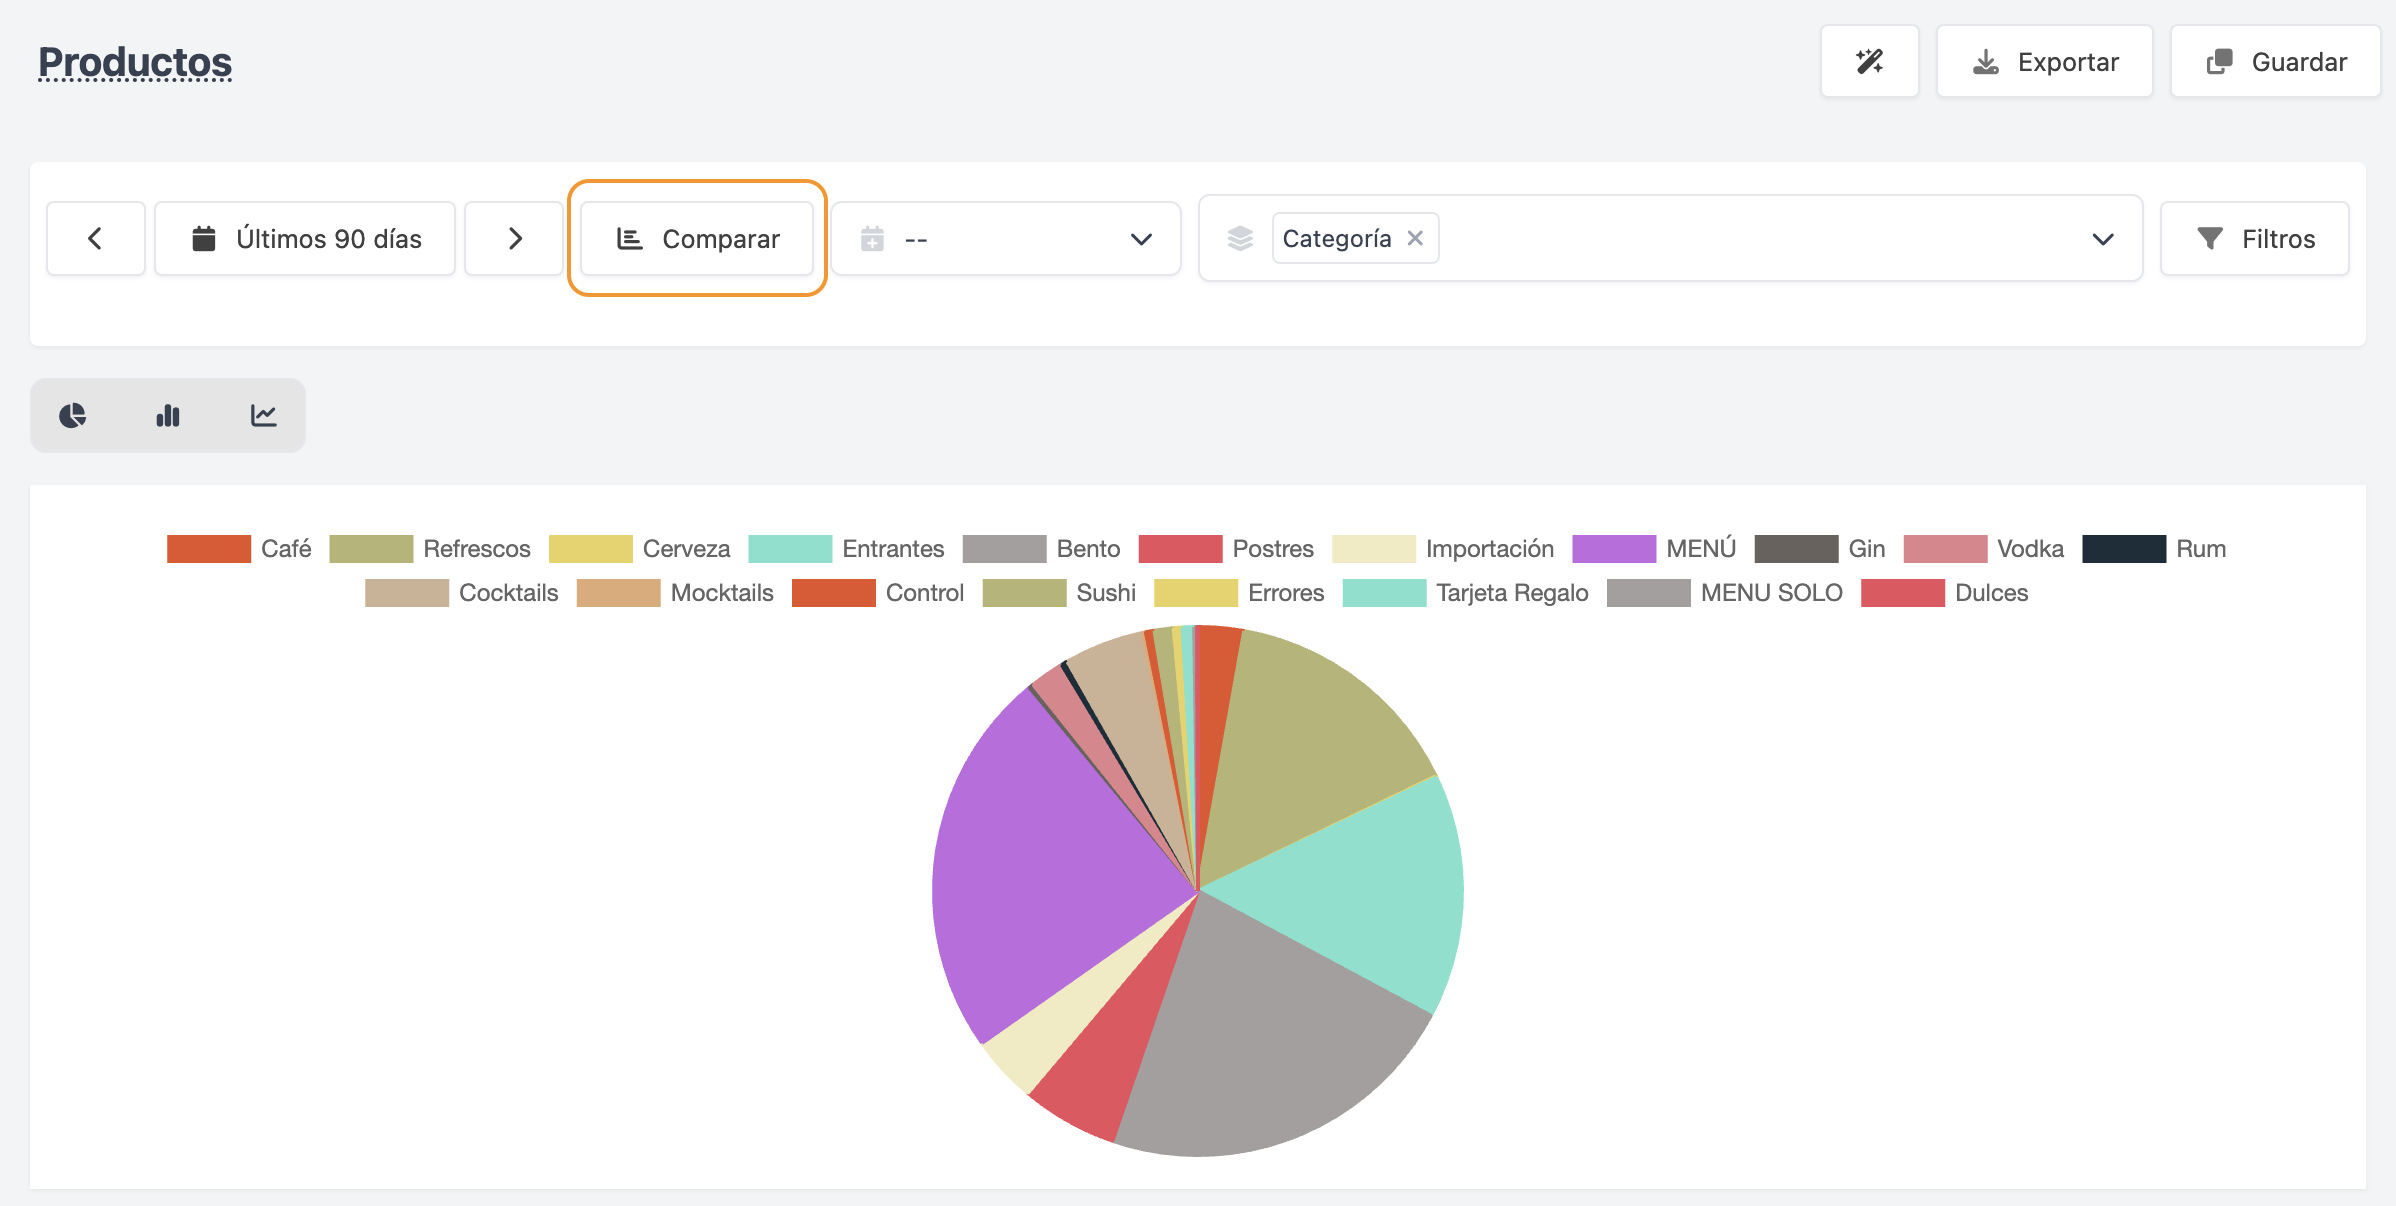
3. Comparison:
This feature allows you to compare reports between different periods.
After grouping, use the "Compare" button to select another date range and compare it to the original:
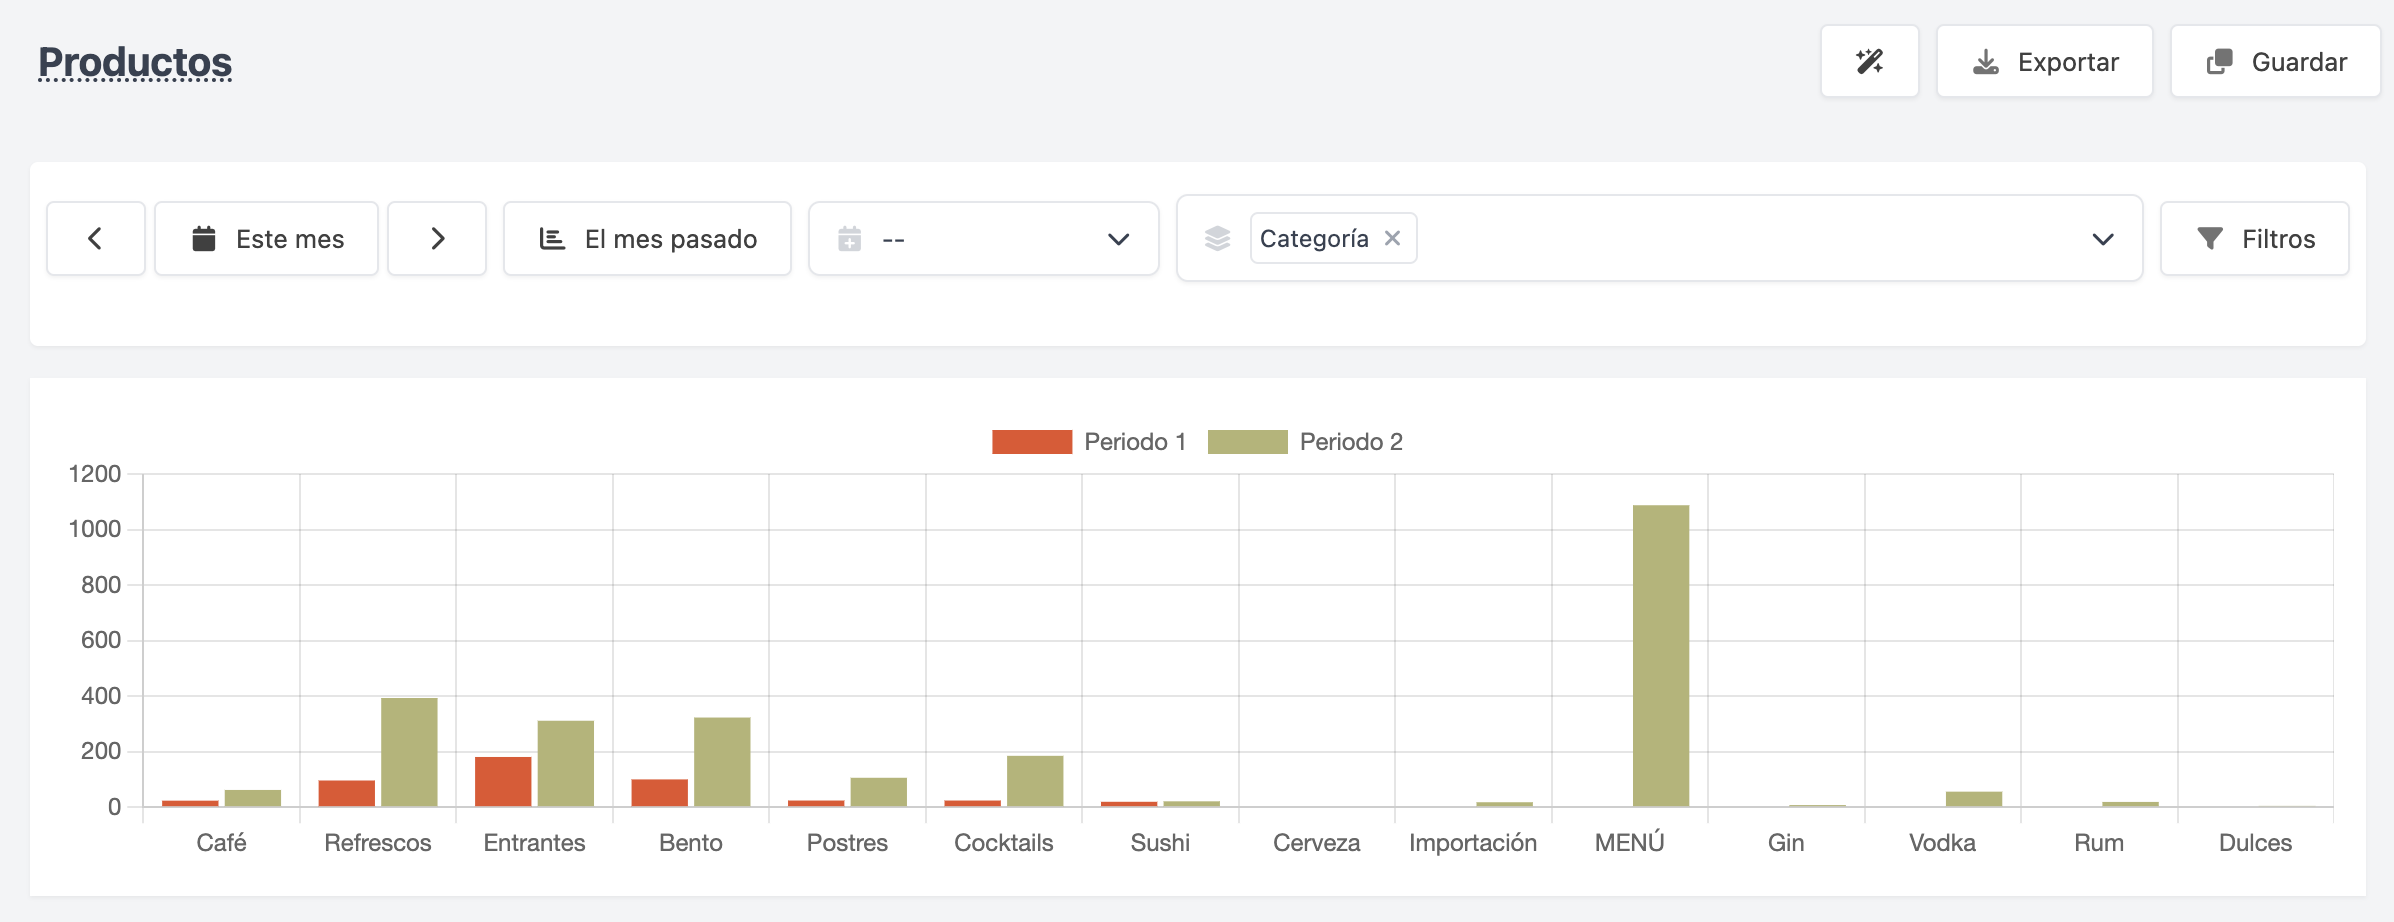
In the following image, you can see an example of comparing the current month's product list with the previous month, grouped by category.
4. Filters:
Use filters to adjust the information displayed in each list. Each list has specific filters.
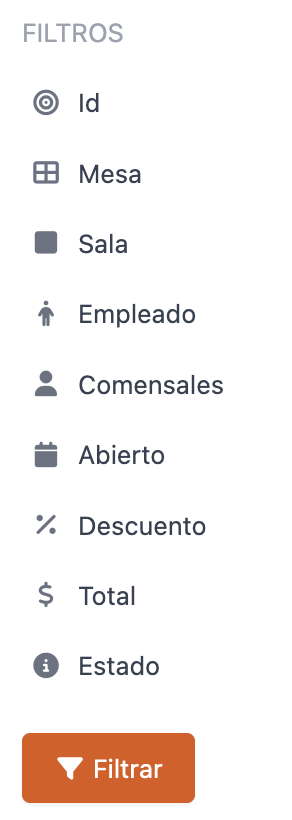
The types of filters are:
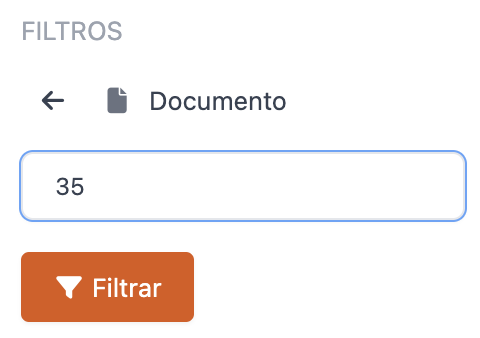
-
Open Field: Allows you to search for any text or number within the list. For example, by searching "35" in the document name, all invoices and delivery notes containing this value are displayed.
-
Dropdown: Presents predefined options to select multiple values.

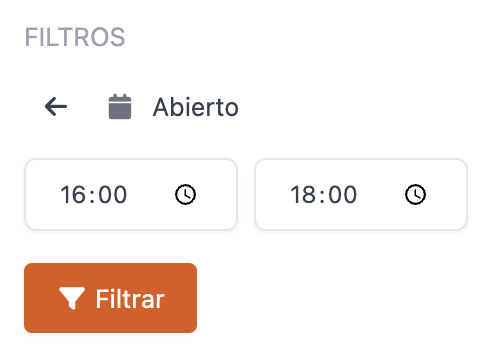
-
Hour Range: Defines a time interval to view generated information.
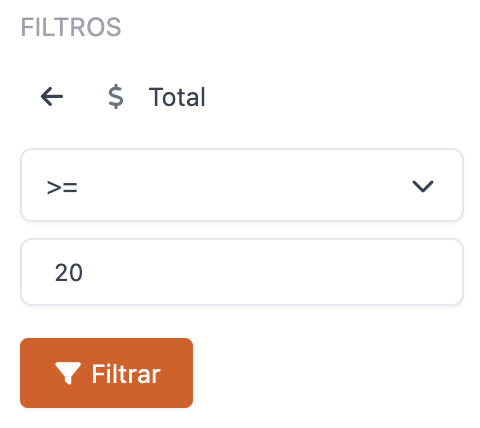
-
Numeric Equality/Inequality: Filters numeric values based on relationships like equal (=), greater than (>), greater than or equal to (=>), less than (<), less than or equal to (=<), and not equal to (<>). Specify the numeric value in the second field. In the following image, we filter documents with a total greater than or equal to €20:
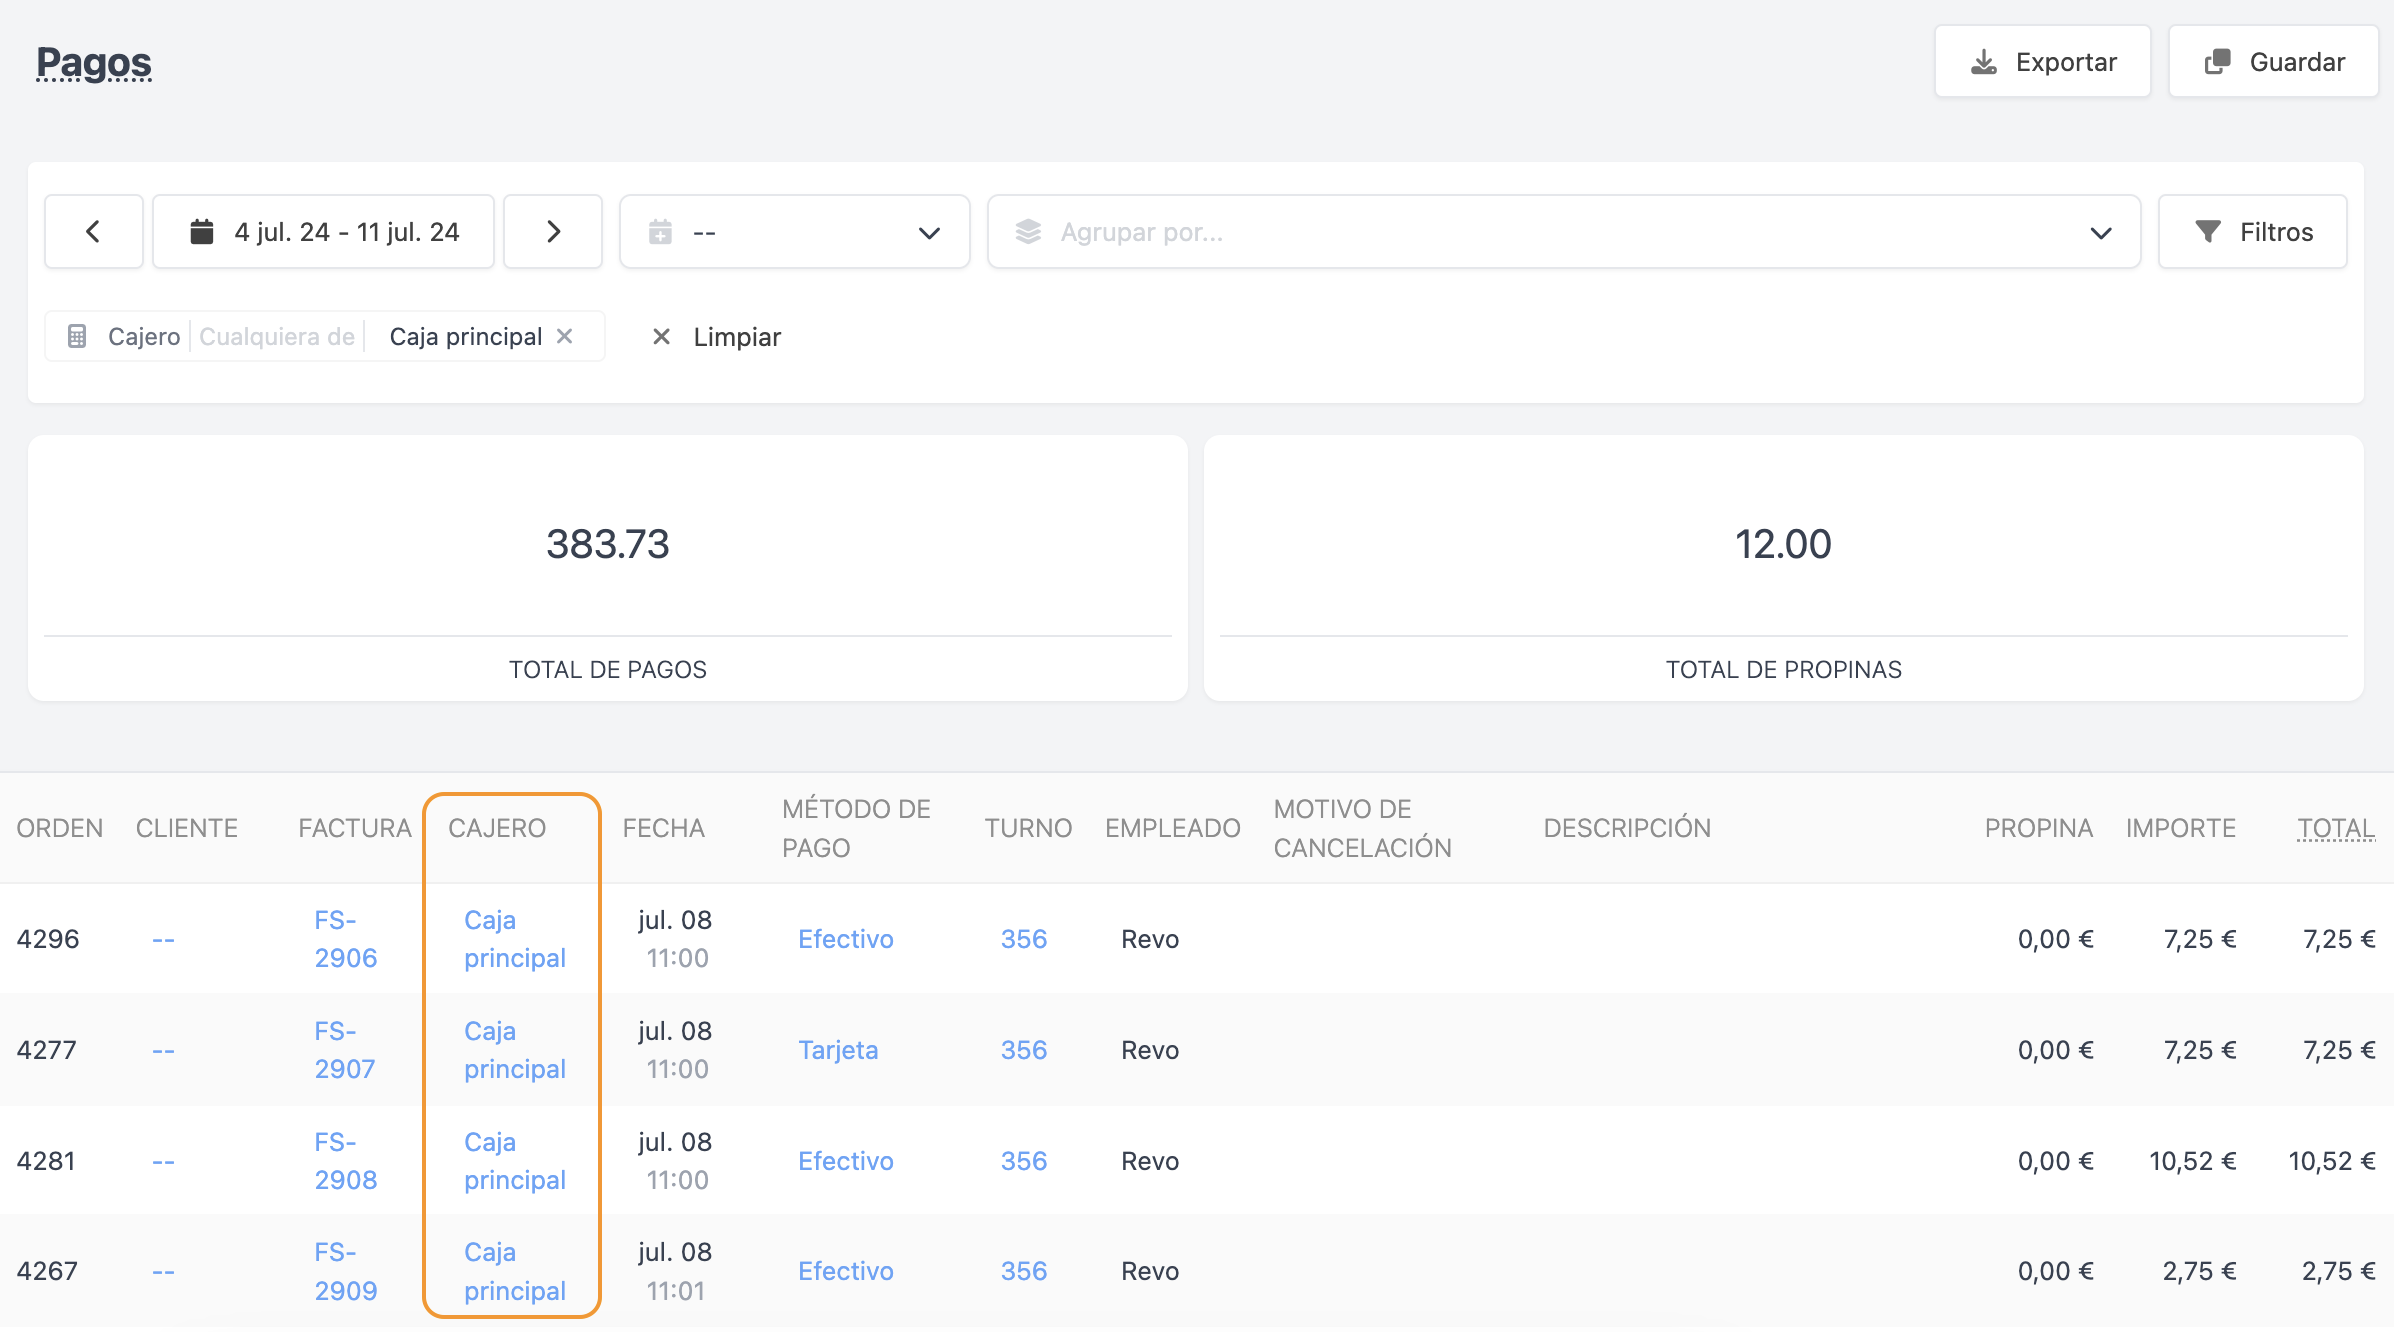
You can also directly filter some fields by selecting them in the list. In the following image, we filter the payment report by "central cashier".
5. Save your customized lists:
Now you can save certain reports while retaining the personalized configurations you have applied using the mentioned functionalities.
To create reports tailored to your needs, simply click "Save" in the top right corner of the screen after applying the filters, groupings, or comparisons of your choice:

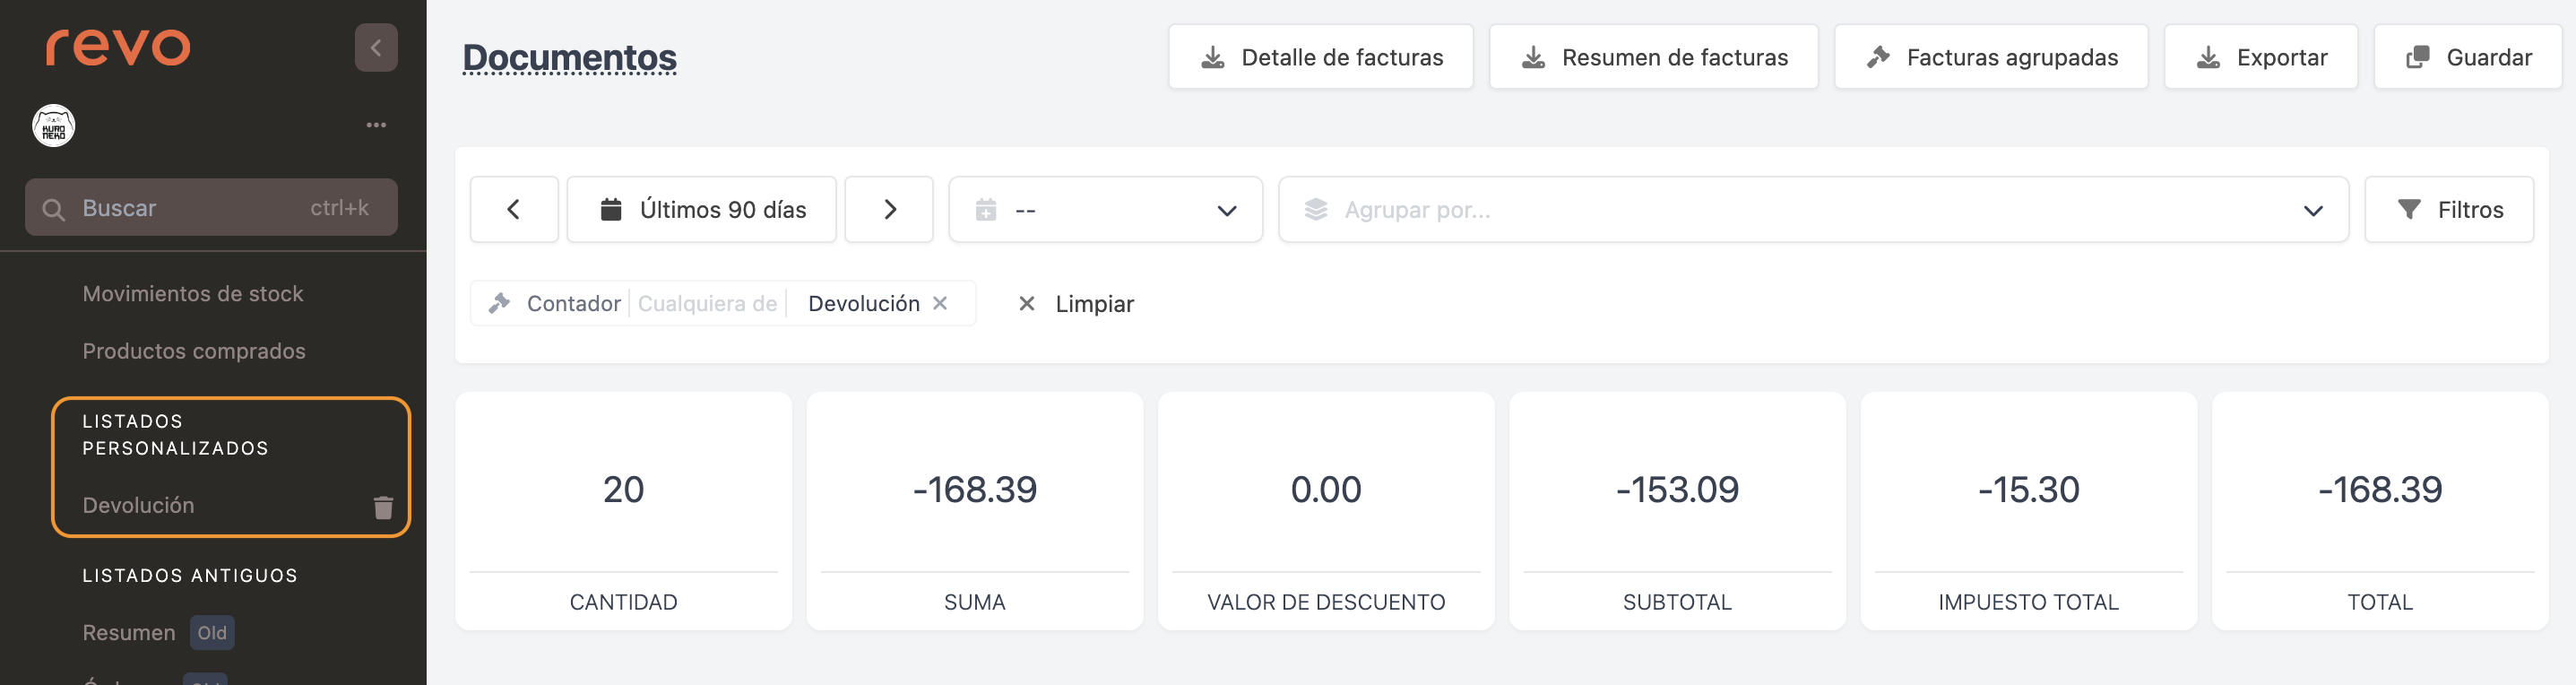
These reports will be saved under Lists - CUSTOMIZED LISTS. In the following image, observe a customized list of returns where we filtered the invoice report by return counter:
If you wish to delete a customized list, simply click on the bin icon on the right side of the list in the sidebar.
6. Export:
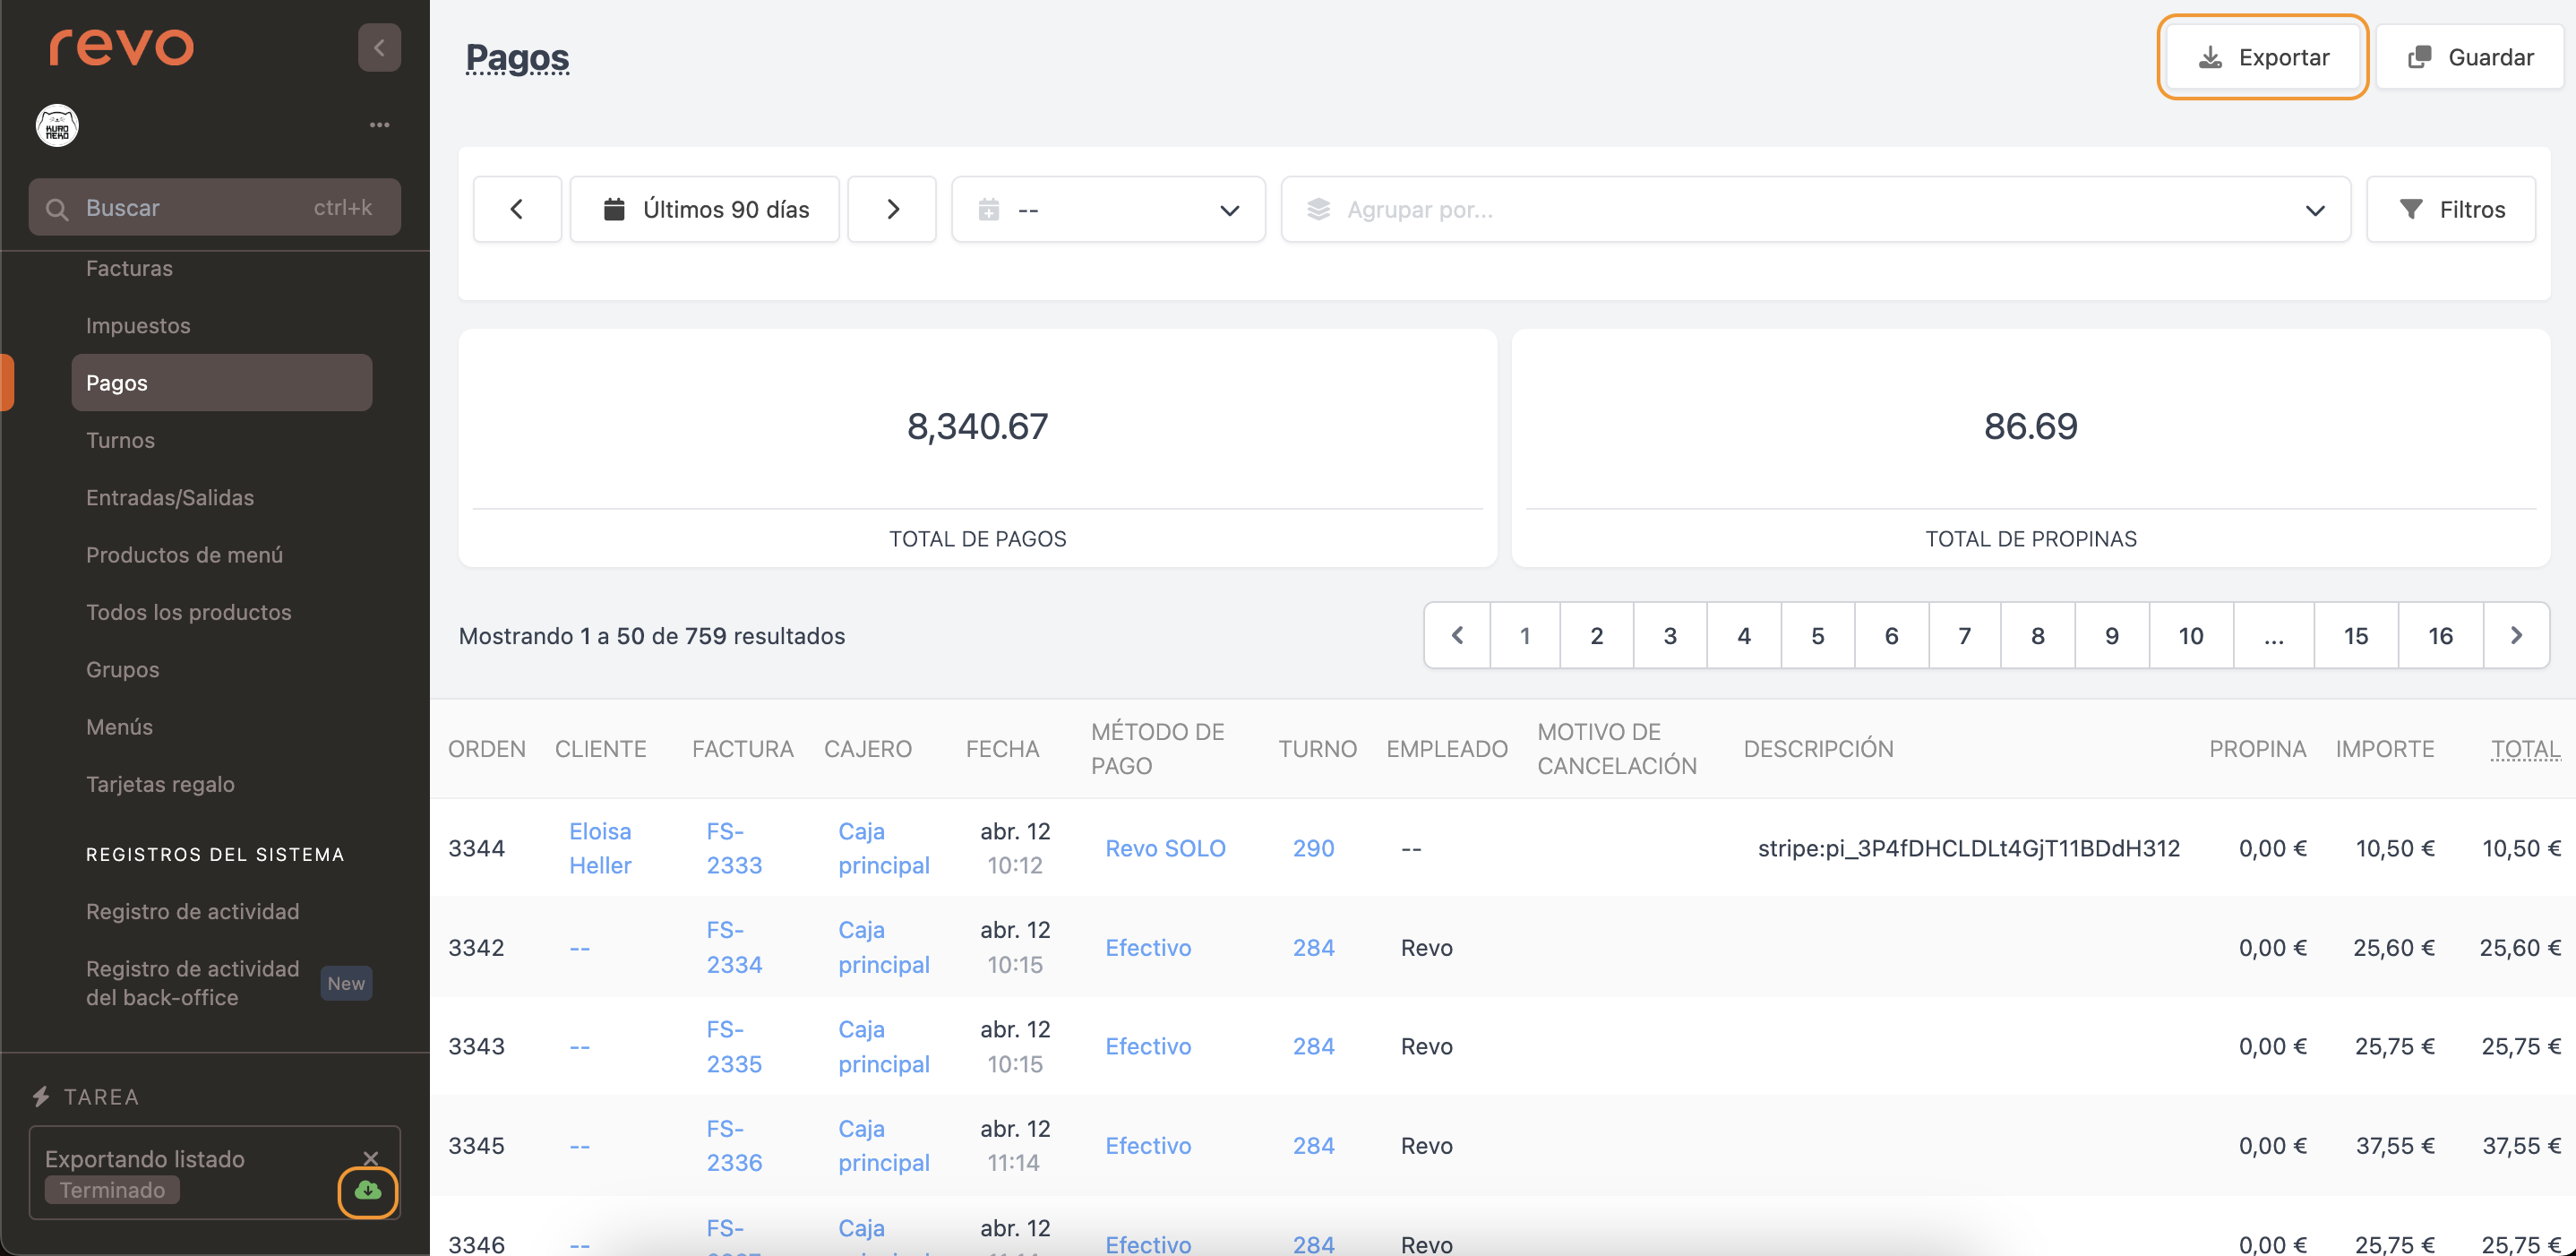
We have improved exports. You can still use the "Export" button to generate a CSV file with the selected list, but now the export will be performed in the background to handle more data and avoid overload issues. Once the file is generated, you can download it from "TASKS" in the sidebar, as shown in the following image:
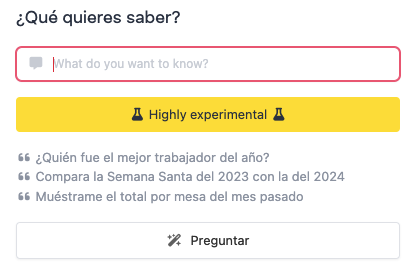
7. Ask:
By clicking on the icon, you can ask the artificial intelligence various questions related to the reports.
Keep in mind that this is an experimental feature.